statistics
Polity.org.za is read by policy makers, lawyers, researchers and those seeking to stay on top of South Africa’s political scene.
Polity.org.za is a member site of the IAB & website statistics are monitored by Effective Measure.
The website generates 39 991 page impressions by 25 178 readers per week.
68% of Polity.org.za readers are based in South Africa.
* select an option below to display the relevant data or download summary of reader statistics in PDF above
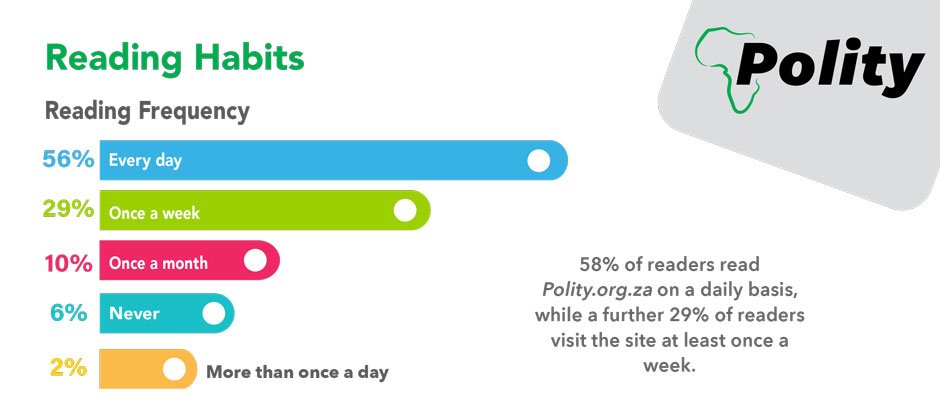
frequency
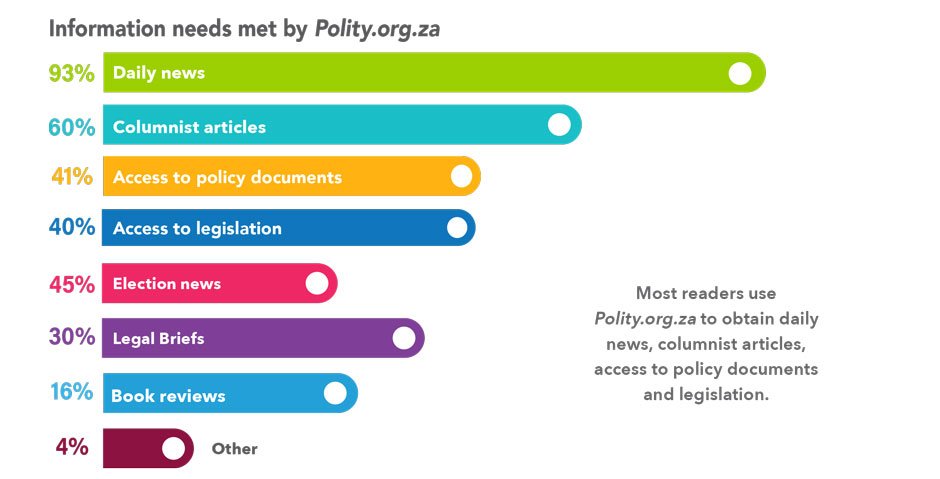
information needs
performance
Readers were asked to score Polity.org. za against selected attributes – on a scale of 1 to 10, where 1 indicates poor and 10, excellent. The largest proportion of readers scored Polity.org.za as follows:
importance of brand image

Readers were asked whether they agree with certain statements regarding brand image and advertising.